1.01.2007

iş değişikliği nedeniyle % 0 tenzilat...

öncelikle, tüm blogosphere'in yeni yılını kutluyorum.

ayriyeten, kurban bayramı'nı idrak etmekte olduğumuz şu günlerde, şöylemesine bir gelişme meydana geldi; pek de ani olmayan bir kararla şimdiki işyerimden ayrıldım. işsizler ordusuna yeni bir nefer daha katılacakmış gibi görünse de, kazın ayağı pek de öyle değil.

kurban bayramı tatilinden hemen sonra türkiye iş bankası'nda başlıyorum.


şimdilik ne kadar süreceğini bilemediğim bir eğitim safhası var, sonrasında ver elini kuleler :P

18.11.2006

stumbleupon

sonunda ben de stumble'lamaya başladım...

http://egiboy.stumbleupon.com/

3.10.2006

tunak tunak tun

bir hint mucizesi - bir izleyen, bir de izlemeyen pişman :P

11.09.2006

ararsan bulursun...

çoooook uzun zamandır web üzerinde çalışabilecek, "graph layout" ("çizge dizgesi" mi desek :P ) da yapabilecek bir uygulama/algoritma arıyordum. AYLARDIR.

sonunda buldum! hem de javascript ile yapmış adam. helal olsun valla; en kralından bir spring layout...

bu da linki.

21.08.2006

foto yükleme zamanı

aslında dandikten de olsa bir fotolog (http://www.fotolog.com/egiboy) ve bir flickr (http://www.flickr.com/photos/egiboy) hesabım var, ama şimdi uydurmaya üşendiğim bir nedenden dolayı şimdi izleyeceğiniz fotoları buraya koyasım geldi.

haydin gari.

10.08.2006

yuh! oha! çüş!

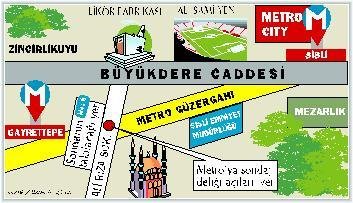
şehir değil lunaparkta yaşadığımızın resmidir:

Örneği çok zor görülebilecek ve yetkililerin bile "Allah korudu. Dünyanın en önemli facialarından biri haline gelebilirdi" dediği türden bir faciya kıl payı ile atlatıldı. İzinsiz yapılan sondaj taksim-4. Levent Metro Hattı’nı, deldi. Bir metro trenini boruların ucuna çarparak hafif hasar aldı.

TAKSİM-4. Levent Metro hattında dün büyük bir faciadan dönüldü. Saatte 80 kilometre hızla giden metro treni, adı açıklanmayan bir firmanın izinsiz sondaj yaparak 25 metre derinliğe inen çelik delici borularına çarptı. İçinde 750 yolcunun bulunduğu metronun ön siperliği ile 2 vagon hasar gördü.

İZİNSİZ SONDAJ

Olay Volga Dış Ticaret’te ait arazide izinsiz yapılan sondaj sonucu yaşandı. Saat 08.00 sıralarında zemin etüdü için sondaja başlayan işçiler, Taksim-4 Levent Metro hattının üzerinde bulunan arazide 25 metreye kadar indiler. Gayrettepe ile Şişli istasyonları arasındaki tünelin 60 cm. kalınlığındaki tavanının da delindiği sondajda facianın eşiğine gelindi. Sondajda kullanılan 10 santimetre çapında ve 3-4 metre uzunluğundaki delici çelik borular Metro tünelinin içine girdi. Bu sırada 750 yolcusuyla 80 kilometre hızla Taksim yönüne giden Ahmet Tektek’in kullandığı metro, sondaj borularına çarptı. Çarpma sonucu aşağıya düşen borular, çekici vagonun siperilği ile 2 vagonda hasara yol açtı. Durum derhal telsizle metro yönetimine bildirilirken metro yoluna devam ederek yolcularını Şişli İstasyonu’nda indirdi. Yolculara bir arıza meydana geldiği ve araçların sefer yapamayacakları söylendi. İstanbul Büyükşehir Belediyesi Başkan Vekili Ahmet Selamet ile Genel Sekreter Mesut Pektaş, dün saat 17.30’da kazanın olduğu tünelde açıklamalarda bulundu. Sondaj için Büyükşehir’den ve Şişli Belediyesi’nden izin alınmadığını söyleyen Selamet, "Facianın eşiğinden döndük" açıklaması yaptı.


KORKUNÇ İHMAL


İstanbul Büyükşehir Genel Sekreteri Mesut Pektaş olayın vehametini şu sözlerle dile getirdi: "Sondajın çelik boruları 2 dakika önce düşse tren yırtarak geçecek. Allah korusun, elektrik kontağı çıkabilir. Dünyanın en önemli facialarından biri haline gelebilirdi." Pektaş, zemin etüdü için 10 metrelik sondajın yeterli olduğunu söyledi.

neresinden tutsan elinde kalıyor.

7.08.2006

egiboy planlama teşkilatı günlük hayat gözden geçirme raporu #3

süper planlarım var, daha çok software üzerine.

bir iki uygulama yazmayı planlıyorum.

anket ve test tasarımı yapabilecek, bunları bir DB'de saklayabilecek ve gelen yanıtları değerlendirebilecek bir uygulama. tercihan bir web uygulaması olacak biri. diğerleri daha herhangi bir zemin üzerinde yoğuşamayacak kadar sıcak, yeterince soğuduğunda haberiniz olur.

bi' de, mrs watson gelecek ya, heyecan var biraz :P

25.07.2006

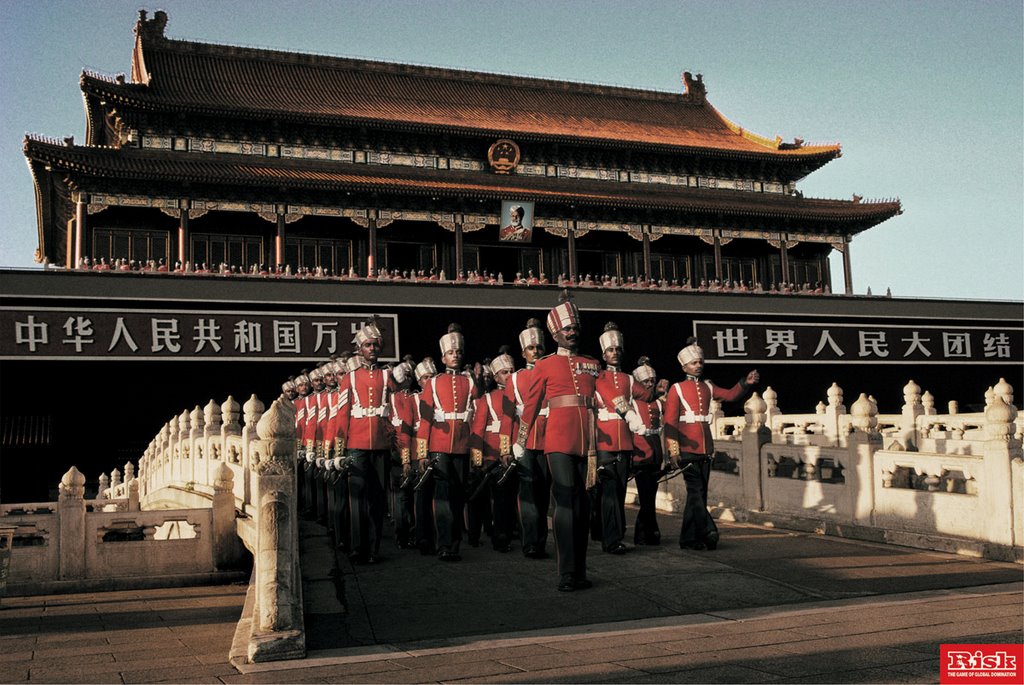
risk reklamları

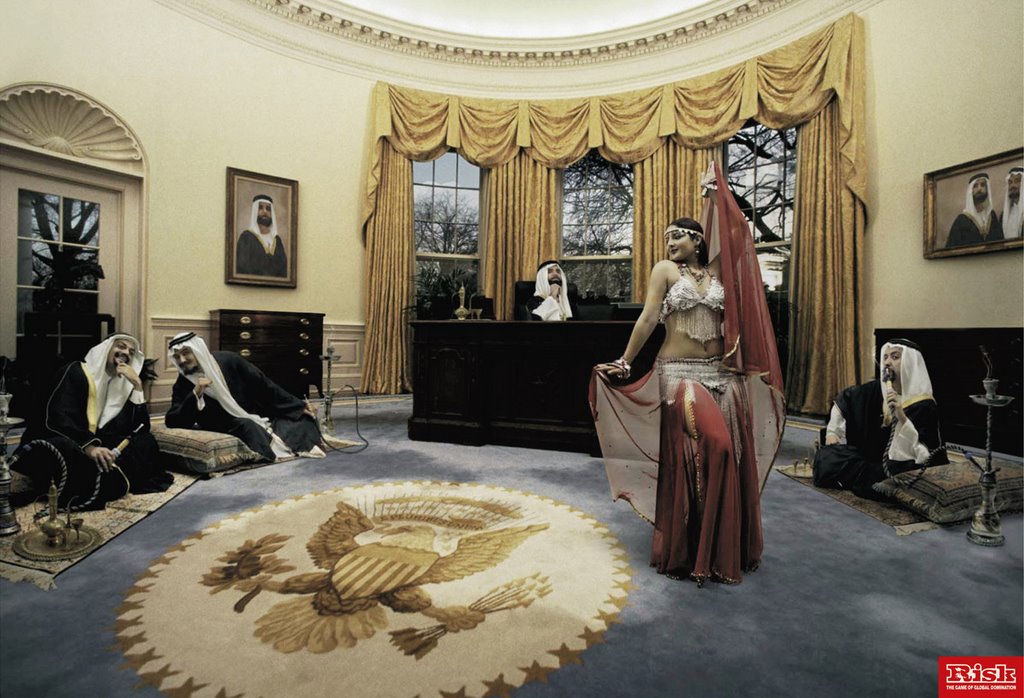
bir "dünya hakimiyeti" oyununun bana göre süper tanıtımları... ingilizya'da zenci babalar, yasak şehir'de hint devriyeler, beyaz ev'de (topkapı, dolmabahçe falan varken "beyaz saray" demeyin ya şuna) yalelli eşliğinde arap alemi. ha-ri-ka!

19.07.2006

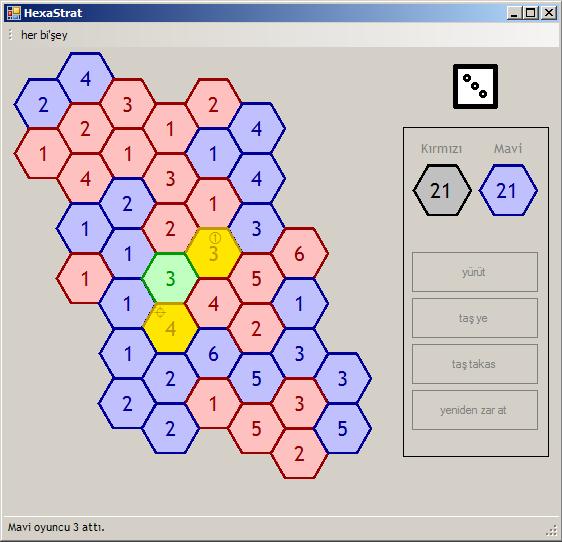
hexaStrat indirme linki

http://rapidshare.de/files/26255188/HexaStrat.rar.html

13 kB'çık bi'şey. tabi, eğer sizde kurulu değilse indirip kurmak zorunda kalacağınız .net framework 2.0 redist package'ı saymazsak :P

bu arada, daha önce bahsettiğim online oynanabilirlik olayını şimdilik rafa kaldırıyorum. neden? üşendim desem?

kurallar ve akış ise şöyle:

  1. kimin başlayacağını belirleyen zar atışlarına her zaman kırmızı oyuncu başlar.
  2. oyuna başlandıktan sonra oyuncular 6 attıklarında isterlerse zarı tekrar atabilirler.
  3. 3 çeşit hamle vardır: takas, taş yeme ve taş yürütme.
  4. taş yürütme hamlelerinde daha önce geçilen bir kareden tekrar geçilebilir. taşlarımızın seyahat özgürlüğü aihs ve evrensel insan hakları sözleşmesi ile garanti altına alınmıştır. dolu karelerin üzerinden atlanamaz, sadece boş karelere hareket edilebilir. geçerli hamleler zaten sizin için işaretlenmektedir, bu da bir nevi tur operatörlüğü servisi, bir başka bakımdan da sovyet "kapalı şehir" uygulamasının oyun dünyasında tezahürüdür.
  5. iki çeşit takas ve taş yeme hamlesi vardır, zarın değerine göre ve zarın işaret ettiği yöne göre. zarın değerine göre takasta seçilen taş, zarda gelen sayıyı taşıyan herhangi bir taşla değiştirilebilir, taş yemede ise seçili taşın yiyeceği taş hem seçilen taşa komşu olmalı, hem de zarda gelen sayıyı taşımalıdır. zarın işaret ettiği yön ise şöyle tayin edilebilir; zarda gelen sayıyı 2 ile çarpın ve saat kadranı üzerindeki yönünü bulun, örneğin 3 attığınızda zarın işaret ettiği yön saat 6 yönü, yani seçili taşın hemen altındaki taştır.
  6. oyuncu zar atıp hamlesini ilgili butonlara basarak seçer, ve sadece seçilen hamle geçersiz ise oyuncunun yeni bir hamle seçmesine izin verilir. hamleler geri alınamaz.
  7. hamle butonuna basılıp belirlendikten sonra oyuncu kendi taşlarından birine tıklayarak hamleyi yapacak taşı belirler. ilk tıklamada taş seçimi kesinleştirilmez, ama seçili taş, seçildiğini belirtir şekilde sarı renkle işaretlenir. bu aşamada oyuncu kendine ait başka bir taşı tıklarsa o taşın rengi sarı olur, önceki tıkladığı ise eski rengine döner.
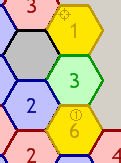
  8. sarı renkli bir taş tıklandığında hamleyi yapacak taş kesinleiştirilir ve rengi yeşile dönüşür. bu aşamada taşın yapabileceği geçerli hamlelerde hedef olacak taşlar sarı ile işaretlenir. ayrıca, eğer zarın işaret ettiği yöne göre bir hamlenin hedefiyse hedef taşın üstünde bir "crosshair", zarın değerine göre bir hamlenin hedefiyse çember içinde 1 sayısı taşın yüzeyinde belirir. örnekleri yandaki resimde görülebilir.
  9. rakibinin hiçbir taşını tahtada bırakmayan oyuncu kazanır.


oyunla ilgili önceki post'lar için: I, II

17.07.2006

hexaStrat revisited

öncelikle buraya bakın derim ben.


bugün sabah gibi oyunun ana kısmını bitirdim. tıkır tıkır çalışıyor, hatta hamle bile öneriyor oyunculara, o derece yani :P


işin kozmetik kısmı kaldı, bir de internet ya da ağ üzerinden oynanabilir hale getireceğim. basit ve umarım insanların zevk alabileceği bir oyun oldu. her biri tamam olunca linkini de veririm artık...

12.07.2006

hayat...

dünya kupası bitti, herkes zidane'ın attığı kafayı konuşuyor.

iş dışında yapmak istediğim hiçbir şeyi yapamıyorum.

önümüzdeki maçlara mı baksak ne...

29.06.2006

ilginç linguistik bükülmeler seri no: 1

kimi zamanlar "geyik çevreleri"nde "isn't"ın kelime oyunları içinde kullanıldığına şahit oluyordum, misal "of coursen't" (ofkozınt gibi okuyunuz, belki tutar), ama daha da "orijinal" bir kullanımına bugün denk geldim.

caiz - caizn't!

denemesi bedava!

28.06.2006

beyaz hoca!

gördüm, yarıldım, paylaşmak isterim :P


mustafa uzer ismini hatırlayan oldu mu aranızda?

26.06.2006

egiboy planlama teşkilatı günlük hayat gözden geçirme raporu #2

geçen seferki listeden hareketle:

  • pl/sql için çalışma yapmıyorum artık, direkt eyleme geçtik. öyle böyle değil.
  • artık çağrı sisteminden geliştirme çağrıları almaya başladım. iki tanesi bitti bile :P sonuncusu ise bayağı zamanımı alacağa benzer, bir master ekran tasarlanması gerekmekte zira.
  • cem'in meşhuuuuur dijital anketiyle ilgili ne yapacağımı bilemiyorum, hiç boş zamanım yok zira.
  • "proce"min raporunu bloga koydum, bundan önceki "comp 491" ile başlayan post'lar onlar. hayrını görenzi.
  • halen ek$iVista web şeysi için grafik çizim paketi arıyorum. galiba cross-platform bişiler yabiciiz, JUNG falan kullanacağız. son görünüm o yönde.
  • hexaStrat olayında atılan zar sonrası hamleleri işleyecek yapıları yazmak kaldı, ki topu topu 4 hamle çeşidi var zaten. lakin, oyunu "foolproof" yapabilmek için devamlı hamle geçerlik kontrolü yapılmak zorunda, ki taş yürütme hamlelerinde biraz takla atmak gerekecekmiş gibi görünüyor. deneyip göreceğiz, bittiğinde de creative commons lisansıyla net'e koyacağım zaten.
  • yukarıda bahsettiğim dijital anket olayı için de bir genel çözüm düşünüyorum; her türlü test tipini üretip veritabanında saklayabilecek bir paket program. kesinlikle pazarlanabilir bir ürün olur.

kapattık kardeşim!

24.06.2006

comp 491: report | references

References

  1. http://en.wikipedia.org/ (“What is Ekşi Sözlük?” section)
  2. http://msdn.microsoft.com/
  3. http://www.codeproject.com/
  4. http://jung.sourceforge.net/ (The basic ideas for the circular layout)
  5. http://netron.sourceforge.net/ (The graph visualization package and documentation)
  6. http://graphviz.org/ (Information about various graph libraries)
  7. C# How to Program, Deitel & Deitel, Prentice Hall, 2001
finito?!?

comp 491: report | conclusion

Conclusion

This project, while it only consisted of ek$iAPI, had started as an exercise in C#, not thinking that a senior design project could be based on it. The source of inspiration for this graph visualization application was the Skitter(*) project which also featured a circular graph, but laid out in a completely different fashion.

After making the decision of doing this project, a tremendous amount of effort was expended to complete it. However, even more could have been expended for a total fulfillment. Quoting from the Preliminary Report:

Scope: A detailed inspection of Ekşi Sözlük data in the form of a digraph as a way of representation, with some simple algorithms employed for coming up with the digraph. Extensions, such as marking the titles one specific suser has written, finding cycles of association or creating timelines (or a histogram) of activity for a specific title can also be implemented.”

“The latter and final step is to design and implement the graphing tool which will work on the extracted data. This tool will make use of some simple algorithms or checks. Some are:
  • Checking the number of entries under a destination title before assigning a connection between two nodes depicting titles. This will be necessary, as links sometimes are used for other purposes by susers, such as emphasizing a part of the entry. Also, some links point to non-existent titles which should be eliminated.
  • Possibly, a node distribution algorithm, so that no node of the graph overlaps with another to allow clarity of presentation.”

The prime objective of the project can be said to be accomplished, as a digraph is generated by ek$iVista. There is a very, very simple algorithm to come up with the digraph; no need was seen for checking the number of entries under a destination title as that quantity carries no importance. References pointing to single entries and clever references were left out, because the connections sought have to be between titles and clever references are generally used to make remarks about a fact and carry no little referential value. The envisaged extensions that were left out in the first version of ek$iVista are implemented in the second, such as the activity histogram or a list of common titles of two arbitrary susers.

Of course, there is plenty of room for improvement. Edges or vertices could be colored according to a measure, such as the number of links from the edge, or susers in the ”yazarlar” tab could be assigned different icons according to their generations

As I stated above, this project started as a small exercise in C# language and expanded into a much bulkier one, helping me master very crucial constructs; accessing databases, acquiring data from the Internet, working with basic graphics, using proprietary packages and many other skills.

Hoping that somebody comes up with a programming language exercise that also improves one’s time management skills…


K. Egemen Şentin
27.01.2006, updated 11.02.2006


(*)Website: http://www.caida.org/analysis/topology/as_core_network/

23.06.2006

comp 491: report | ek$iVista

ek$iVista

The Problem: Designing a program that generates a digraph from the edge data generated by ek$iEdgeDump.

Design: This part of the project was the most troublesome part, involving a cascade of decisions. As the project supervisor, Prof. Attila Gürsoy advised making use of graph layout libraries, such as JUNG(*) (Java Universal Network/Graph Framework), yWorks(**) or GraphViz(***). During the research phase, however, it was observed that neither of these options was worth the effort; JUNG could not be used within C#, yWorks was a commercial package with costs beyond my budget for the foreseeable future, GraphViz seemed too hard to implement. Later on, I found a Windows DLL port of GraphViz(****) and modified ek$iVista to generate a text file in DOT format (file format accepted by GraphViz). However, the lexer inside GraphViz could not parse the text file generated by ek$iVista with no apparent reason, so the use of the GraphViz was out of question. It was becoming obvious that the layout algorithm and generation of the diagram had to be handmade.

From a very large array of layout algorithms, like the Kamada Kawai algorithm, a random vertex-placement algorithm and many tree layout algorithms, the circle layout was chosen, because in this layout, the vertices were pushed near the borders of the diagram and the center part was left vacant for the edges to be placed. Also, the coordinates of vertices and edges could be calculated by simple trigonometry. First of all, a minimum distance between two vertices is defined; let us name it md. If there are v vertices laid out evenly on the perimeter of a circle, the perimeter is expected to be roughly (md x v) units. The radius of the circle, hence, is (md x v)/2π. The position of the nth vertex on the diagram, given the center of the diagram as the Cartesian pair (cx, cy) is the Cartesian pair (cx + cos(360n/v)((md x v)/2π), cy + sin(360n/v)((md x v)/2π)). As we know the coordinates of the vertices and have a list of edges, drawing the directed edges should be trivial.

Everything is expected to fit in without any problems, but expectations are not always met. For enabling interactive vertices that respond to clicks, a control named VistaVertex was created which contained four buttons envisaged to fire some events and methods. However, as the number of vertices rose, the application became more than cumbersome. Also, an unadvertised “feature” of Windows surfaced; one cannot create more than 10,000 controls per application, because Windows cannot generate “handles” for them. Because of this limitation, the use of controls was impossible; the diagram had to be painted on the form and it could not be interactive for the time being. During this phase, I had mounting difficulties when the form had to be refreshed, because whole diagram had to be painted from scratch and I could not figure out a method to avoid this. Finally, I decided to generate a viewable image by using the graphics libraries provided in C#, and discovered another hidden limitation; drawing images larger than 32,678 x 32,768 was impossible. Such a limitation was also imposed upon the size of forms; although the property that keeps the height and width of the form is of type Int32 (232 ≈ 4 x 10⁹), the maximum value it accepted was 215. With the current number of vertices, however, this poses no big problem.

The program first reads the source titles into a Hashtable and gets the total number of vertices. After this, a SortedList (a Hashtable sorted according to the keys of the items) object is populated by Point objects that store the calculated coordinates of the vertices with the title names assigned as their keys. Then, EksiEdgeData table is read from beginning to end; if the source title corresponds to a key in the hashtable, the directed edge is drawn. After all the edges are drawn, the vertices are drawn onto the image, and finally, the image is saved at a fixed location, the root of the C:\ drive.

-assume that here placed is a friggin' large image which resembles the lunar surface or a colour-inverted solar eclipse-

The graph drawn by ek$iVista, although substantially rich in data, is not very adept at displaying the connections between Ekşi Sözlük titles as much of the meaning is lost in the clutter. As it was stated before, the “final” graph produced contained the details of only a small portion of Ekşi Sözlük data and finally, the graph, although envisaged to be interactive at first, was far from interactivity. To rectify these shortcomings, a new version for ek$iVista was
written. A new problem statement would do this new application justice, and it is given below:

The Problem: Providing means of visualizing and analyzing Ekşi Sözlük data gathered by ek$iDump – especially the links between titles and the users contributing to titles. Also, correcting the flaws of the first version; trying to draw the whole graph which makes it unintelligible, having to rely on a separate table (EksiEdgeData) generated beforehand to come up with the graph while the data for it could be generated on-the-fly, and providing no outlets for interactivity.

Design and Implementation: The first design decisions were about what to include in this application and what to leave out. To see what has been done clearly, let us use a weekly update mail as our checklist:


“I spotted a graph visualization package named Netron (http://netron.sourceforge.net/) and will be using this package for the title connections graph.”

The graph visualization package that has been used, as it is stated above, is an open-source package named Netron, an initiative started by François Vanderseypen to provide a functional library of tools written in C# for producing diagrams in .NET platform. Netron contains many object types necessary to draw a connectivity graph and also some layout algorithms, such as the tree layout, random layout and the spring embedder. As the library is open source, it is freely extensible. Another interesting feature of this library is its support for drawing cellular automata outputs. The title connectivity graph generated by ek$iVista makes use of this library and the layout algorithm chosen is the spring embedder algorithm.

  • “The queries that I am going to use in ek$iVista are:
    • The one that will be used to draw the connectivity graph (with the option of displaying titles 1, 2, 3, 4 and 5 clicks ahead)
    • Simple queries that will list the users who contributed to the title and the entries under the title (with the option of opening it from the database with or directly from Ekşi Sözlük)
    • Queries that will help to draw timelines for activity, for titles and users
    • A query for finding the "intersection set" of the titles written to by two distinct users”

All the queries mentioned above are included with one addition and one exception; the option of opening the entries under a title from the database was omitted as Ekşi Sözlük contained the most up-to-date information on any title imaginable, and as listing more than 700,000 titles in a combo box used to select the title to work on is a fairly daunting task, a query for listing the 10 titles most relevant to the given input was added. These queries were implemented as stored procedures as the data traffic is minimized between the application and the RDBMS and time is used more efficiently as stored procedures precompiled and prepared; they do not have to be compiled over and over like other SQL statements. The number of stored procedures used is five, and they are:

top10matching: Returns the first 10 matches to the title value input.

CREATE PROCEDURE top10matching @whattitle nvarchar(50) AS SELECT TOP 10 title FROM Titles WHERE title LIKE @whattitle

entryProc: Returns the full list of entries entered under a title.
CREATE PROCEDURE entryProc @whattitle nvarchar(50) AS SELECT * FROM Entries WHERE title = @whattitle
suserIntitle: Returns the full list of susers (without repetition) under a title.

PROCEDURE suserInTitle @whattitle nvarchar(50) AS SELECT dbo.Susers.suser, dbo.Susers.suserID FROM dbo.Susers INNER JOIN dbo.Entries ON dbo.Susers.suserID = dbo.Entries.suserID WHERE (dbo.Entries.title = @whattitle) GROUP BY dbo.Susers.suser, dbo.Susers.suserID

entriesOfSuser: Returns the full list of entries contributed by a suser.

ALTER PROCEDURE entriesOfSuser @whatsuser int AS SELECT * FROM Entries WHERE suserID = @whatsuser
togetherProc: Returns the titles (without repetition) written to by both of the two given susers.

PROCEDURE togetherProc @id1 int, @id2 int AS SELECT title FROM dbo.Entries WHERE (suserID = @id1) GROUP BY title HAVING (title IN (SELECT title FROM dbo.Entries WHERE suserID = @id2))


Although the queries used are fairly simple (the last one is a simple nested query) any timewise gain obtainable had to be obtained, because the system the database runs on (an AMD Athlon 2000+ with 512 MB main memory) is not very powerful as to meet Microsoft SQL Server’s needs.

Other design decisions will be explained in detail in the Walkthrough section, where a normal run of ek$iVista is exhibited.

Walkthrough:
A splash screen like this welcomes the users of ek$iVista.


Fig. 6: Splash screen of ek$iVista


If not desired, it can be eliminated by passing /nosplash argument before running the application. The splash screen was seen as necessary because the user has to be sure that the program is functioning normally as the application strives to scan all (exact number is 781, 367) of the titles in the database and add them to a Hashtable which will be used to check whether the destination titles exist or not. After the scanning of titles is complete, the main form of the application is displayed:
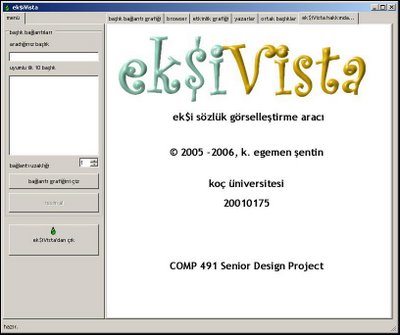


Fig. 7: ek$iVista - overview


As one can see, the interface is fairly simple with TabView components used as sub-forms. An MDI (Multiple Document Interface) form could have been used instead, but MDI forms are not very easy for the end user to deal with and can get scattered around, providing a messy outlook. The tabs contain controls that help display the outcomes produced by the program; “başlık bağlantı grafiği” (title connectivity graph) displays the connectivity graph of a title by making use of the Netron graph control, “browser” displays the contents of titles in Ekşi Sözlük with the help of an Internet Explorer control, “etkinlik grafiği” (activity graph) displays the activity recorded under a title or of a suser in the form of a 3D bar chart with the aid of a Microsoft Chart control, and “yazarlar” (writers) and “ortak başlıklar” (common titles) display the writers (susers) under a title and the common titles of two susers, respectively. These two tabs make use of the ListView control.

At the main entry point, we begin by entering some text in the text box under the label “aradığınız başlık” (the title you are looking for). As one types further, the list below the text box is updated by using the top10matching query to list the 10 titles that are the most relevant to the text entered. This feature helps users to narrow down their searches and find titles when they are not sure of the title they want to inspect. An example is given below.


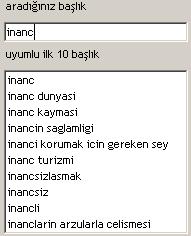
Fig. 8: Title search feature


We advance by selecting a title from the list, select a value for the hop distance (between 1 and 5, inclusive) from the number selector and click “bağlantı grafiğini çiz” (draw connectivity diagram) to see the connectivity graph with the selected title as the center and the titles at the clicking distance selected from the number selector. If one clicks the button without selecting a title from the list, an error message is displayed.


Fig. 9: Error message - "A title should be chosen from the list."


This connectivity graph is drawn by a BFS (breadth-first search) – like algorithm which takes a starting node (title) and scans through the entries under a title, adding the links inside the entries to a list and drawing the connections between them. If the final hop value is not reached, the titles inside the list formed are scanned and the method for drawing the graph is called for every value in the list.

The graph drawn when the selected title is “inanç lisesi” (the high school that I was graduated from – now known as TEV İnanç Türkeş Özel Lisesi(*****)) and the hop distance as 1 is shown below, with the context menu shown when a title is clicked.


Fig. 10: Title connectivity graph with its context menu

The context menu options are:
  • “benzer başlık bul” (find similar titles) posts the title name to the text box labeled “aradığınız başlık”,
  • “yazarları göster” (show writers) displays the list of susers who contributed to the title in the “yazarlar” tab,
  • “etkinlik grafiği” (activity graph) shows the activity graph of the title in the “etkinlik grafiği” tab,
  • “ek$i’de aç” (open in ek$i), as its name suggests, opens the title in Ekşi Sözlük, displayed in the “browser” tab.

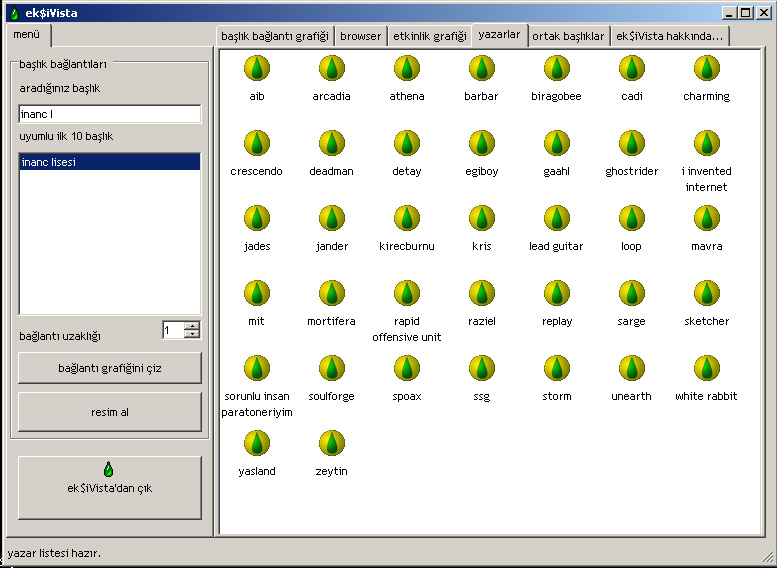
Let us see who has written under the title “mit” by clicking the appropriate menu item. The result, produced by the susersInTitle query, is shown in Fig. 11:


Fig. 11: The list of users who have written under the title "mit"

The activity graph of the title “mit” is obtained by clicking “etkinlik grafiği” in the context menu, which is a bar chart displaying the monthly entry counts of a title or a suser. Three types of activity graphs exist; a general view which displays months, years and number of entries on the axes, the month-based view which shows the counts of entries entered in the 12 months of the year and the year-based view which shows the entry counts corresponding to the years starting from 1999, the year Ekşi Sözlük was established. All three graphs are shown below, in Figs. 12:


Figs. 12: General, monthly and yearly activity graphs for the title "mit"

Activity graphs are obtained by calling queries that return entry data. In this entry data, the date the entry was entered is stored as a string value, since, in Ekşi Sözlük, both the date of entry and – if the title is edited later on – the date of the latest edit is stored. As it was not desirable by the designer to work on tables that contain null values (the edit date for entries that are not edited), this scheme of storing date values was adopted; strings can be programmatically parsed down to integer values.

A two-dimensional integer array for storing entry frequencies is created and for every entry data acquired, the date string is obtained, the month and year value is picked and the frequency value corresponding to the month and year value is incremented by one. After all the entry values are consumed, the array is fed to the graph control as data, and thus the activity graph is drawn.

Going back to Fig. 11, we can experience more of the functionality of ek$iVista. When we right-click any portion of the susers list, a context menu appears as shown in Fig. 13. This context menu provides two choices for the user; “ortak başlıkları listele” (list common titles), when two suser names are selected, lists their common titles in “ortak başlıklar” (common titles) tab, and “etkinlik grafiği” (activity graph) which displays the activity graph pertaining to the selected suser. If the selection criteria (selecting 2 susers for “ortak başlıkları listele” or selecting 1 suser for “etkinlik grafiği”) are not met, error messages are displayed. Let us see what happens when we choose two arbitrary susers from the list and request to see their common titles. The common titles list for the susers “yasland” and “zeytin” are shown in the figure below:
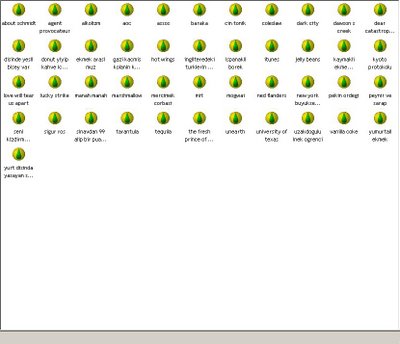


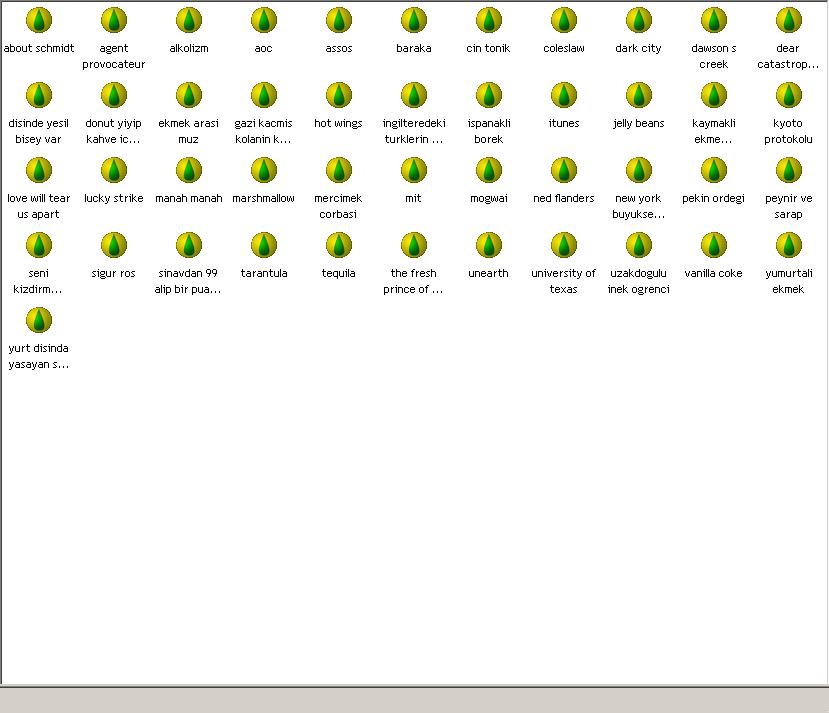
Fig. 13: Common titles list for the users "yasland" and "zeytin"


The items in this tab, “ortak başlıklar”, have the same functionality as any title node in the connectivity graph and have the same context menu. Thus, the details can be inferred from the lines above which mention this context list.


(*): Detailed information about JUNG can be obtained from http://jung.sourceforge.net/.
(**): Website: http://www.yworks.com/
(***): Website: http://graphviz.org/
(****): Website: http://home.so-net.net.tw/oodtsen/wingraphviz/index.htm
(*****): Detailed information can be obtained from http://www.tev.org.tr/ or http://tevitol.k12.tr/.

comp 491: report | ek$iEdgeDump

ek$iEdgeDump

The Problem: Extracting links (connections) from the existing “heap” of entries.

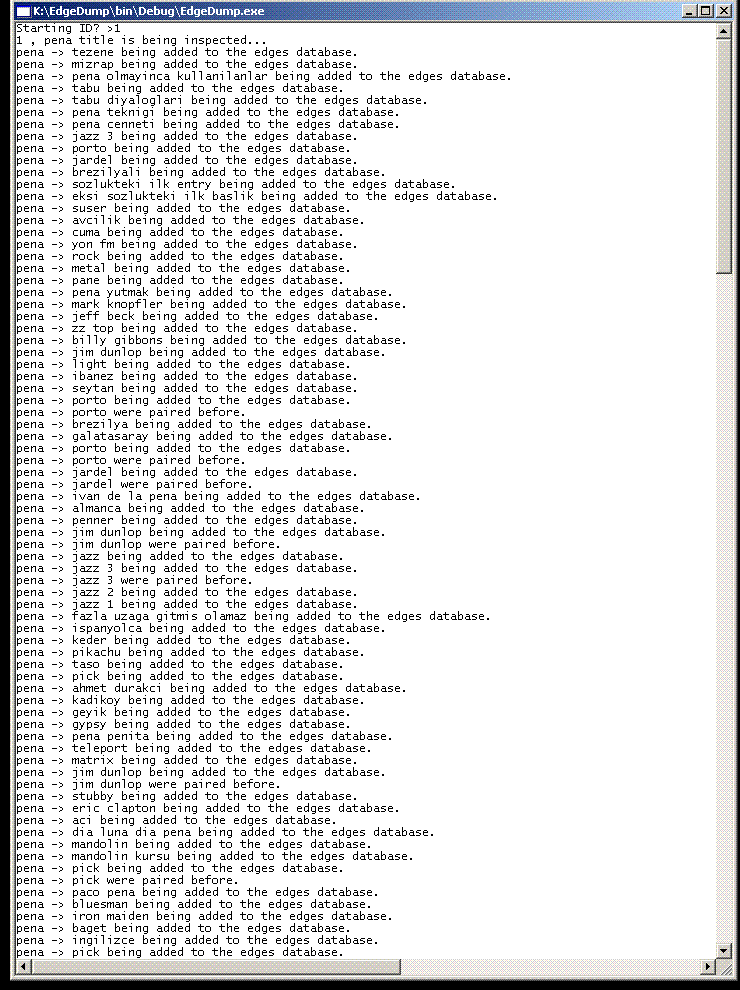
Design: For ek$iVista to be able to function, to be able to produce a digraph, it needs a list of directed edges, and ek$iEdgeDump was produced for this purpose. For the sake of simplicity, like ek$iDump, it is also designed as a console application. During the development, two versions of ek$iEdgeDump were produced. The first version gets the full list of titles in the database (a table named Titles exists in the database) and scans them one by one. In this scan, the entries under the title being scanned are inspected and any link that points to a title (those that point to single entries are omitted) is parsed out of the entry text. Then, another database query checks whether the title pointed by the link exists in the title list. If it exists, the pair consisting of the IDs of the source title and the destination title (the records in the Titles table have a title ID and title name) are written to a table named EdgeData, only to be used by ek$iVista in drawing the digraph. This approach proved to be too slow, because for every link found in an entry, a verification query has to be made. The scan rate of this version of ek$iEdgeDump was less than 1,000 titles/day. Given the fact that the database contained more than 700,000 titles, the job would be completed in nearly two years. Clearly, another approach had to be adopted .

In the second version of ek$iEdgeDump, the focus is back on the entries instead of the titles. As one can recall from the description of the Entry class in ek$iAPI, one of the details of acquired from Ekşi Sözlük when an entry is extracted is the title the entry is placed under. Thus, we can produce a different table that looks like the EdgeData table described above that keeps information of the source and the destination vertices of the directed edge. The table, in the new approach, is produced by scanning the entries in the database (they reside in a table named Entries), parsing out the links that point to titles and writing the pair consisting from the name of the source title and the destination title to a table named EksiEdgeData without checking whether the destination title exists in the Titles table. This verification effort was the factor that slowed the first version down, and it can be handled without querying the database by ek$iVista (the details of how this is done are given in the section discussing ek$iVista). As the title data in the Entries table is stored in string format (not as integers; foreign keys related to title ID column in Titles table), the size of the EksiEdgeData table is significantly larger than that of EdgeData. ek$iVista uses the data from EksiEdgeData table, generated by the last version of ek$iEdgeDump.


Fig. 5: ek$iEdgeDump versions 1 and 2 in action

comp 491: report | ek$iDump

ek$iDump

The Problem:
Coming up with a portable application to acquire Ekşi Sözlük entries and store them in a database.

Design: Although the final product of the project will be a graph depicting connections between Ekşi Sözlük titles, the connections arise from the content of the titles, which are, obviously, the entries. That is one of the reasons why ek$iDump is a tool for getting the entries rather than the titles. Another and maybe the prime reason for focusing on entries is that entries have unique integer IDs that allow them to be acquired one by one in a for-loop or a while-loop.

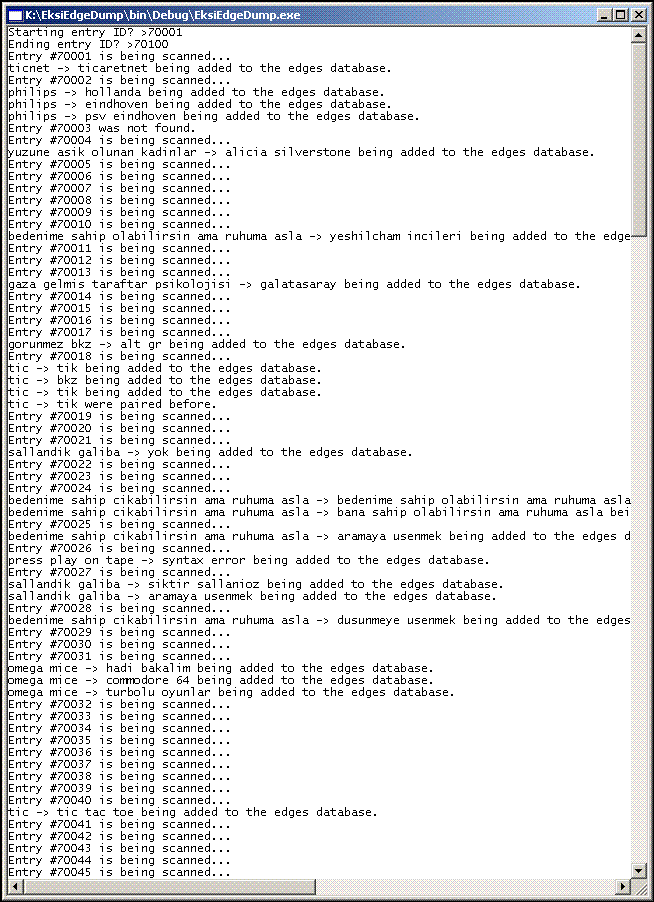
ek$iDump is, due to this nature of Ekşi Sözlük entries, at the level of complexity of a “Hello World” program. The program, designed as a console application, gets the starting ID and the terminal ID as its input, which are integer values. In a while-loop, beginning from the starting ID, if the entry with the given ID exists, it gets it from Ekşi Sözlük by calling Entry.GetFromEksi(ID) and writes the details of the Entry acquired to the database. The database of choice is a Microsoft Access file, because one does not have to set up a server for using it; even if you do not have Microsoft Access installed, one can obtain and install a package named Office 2003 Redistributable Primary Interop Assemblies and get on with using the database. Also, the data accumulated in the database is easily exportable to Microsoft SQL Server, which the other two sections of the project, ek$iEdgeDump and ek$iVista use. One always has to make the quantum leap from Microsoft Access to another pro-level RDBMS at some level, as Microsoft Access imposes a size limit of 2 GB on a database file. Note that although it is by no means final, the size of the database file generated in the course of the project exceeds 5 GB. An image showing ek$iDump in action is given in the figure below:


Fig. 4: ek$iDump in action, dumping entries

comp 491: report | ek$iAPI

ek$iAPI

The Problem: Retrieving information from Ekşi Sözlük and organizing it programmatically.

Design: In the very beginning, the plans were basically getting started with ek$iDump and incorporating data acquisition functions into some method inside the main class. That would have been very easy to start with, however, if I wanted to use the portions of code that access Ekşi Sözlük in another application, all had to be re-written. To avoid such circumstances, a different style of programming had to be adopted. After some contemplation, I decided to program this part of the project as a class library. Class libraries are collections of classes and methods inside classes, and when compiled in Visual Studio.NET, are built into Windows DLLs. Thus, I would be able to reuse the code in any application.
Although it carries no formal significance, ek$iAPI did spring from the drawing board:


Fig. 3: Primordial sketches


In the initial sketch, there number of classes envisaged was six; entry class for storing entry data, a message class to exploit the messaging facility of Ekşi Sözlük, a today class for storing the titles written to in a specific day, a random50 class for returning 50 titles chosen at random by using the search facility, a suser class to store any particular information obtainable about an Ekşi Sözlük user, and a title class for storing entries posted under a title. In the final release, however, some of these envisaged classes were dropped. Message class was discarded as it would provide no functionality for the time being; classes today and random50 were discarded as they were collections of title objects and thus were redundant. As a result, the only classes implemented which were also on the “primordial sketch” are Entry, Title and Suser classes.

This class library is utilized by ek$iDump, Ekşi Sözlük entry acquisition tool, which is described in the next section.